
If the city of Tokyo were a country, its gross domestic product (GDP) of about $976 billion would place it between Spain’s ($1,042 billion) and the Netherlands ($914 billion).
In this article, we breakdown the prefectural and regional GDPs of the 47 prefectures and seven regional blocks of Japan (as defined by Japan’s Cabinet Office) to give our readers an idea of the relative size and contribution of the various regions of Japan to the overall economy and how they compare to various countries in the world.
Overview
Here are a few key points to know about the economy of Japan and the country’s key cities and regions:
- Japan has the third largest economy in the world, with a 2018 GDP of $4,791 billion, ranking behind the United States and China.
- Tokyo’s GDP of $976 billion (in 2016) comprises about 19% of Japan’s GDP.
- The combined GDP of the Kanto region (which consists of the prefectures of Ibaraki, Tochigi, Gunma, Saitama, Chiba, Tokyo, Kanagawa, Yamanashi, and Nagano) is about $2,097 billion, compared to Italy’s GDP of about $2,084 billion (2018).
- The second biggest prefectural economy in Japan is Aichi ($368 billion), a major international automotive manufacturing hub and headquarters to Toyota.
- Osaka ranks third in Japan, with a GDP of $364 billion.
- There are major disparities between the urban centers and rural prefectures of Japan. In 2016, 35 prefectures in Japan had GDPs that were 10% or less of Tokyo’s.
- Tottori has the smallest of Japan’s GDPs, at about $17.4 billion.
Data used in this article is from the most recent available from Japan’s Cabinet Office (November 2019 report on Japan’s 2016 prefectural economies) and the World Bank (2018). Japanese yen amounts have been converted into USD at the current rate of JPY 107 = 1 USD.
GDP by Prefecture
Below we rank Japan’s 47 prefectures by GDP and show the difference in GDP of the other prefectures compared to Tokyo’s.


GDP by Region
Below we breakdown the regional economies of Japan’s seven main economic regions, as defined by the Cabinet Office.
Japan’s seven main economic regions ranked by GDP (2016) in billions of USD at 107 JPY to the USD.
| Kanto | 2096.65 |
| Chubu | 791.55 |
| Kinki | 786.26 |
| Hokkaido | 579.81 |
| Kyushu | 469.07 |
| Chukoku | 290.64 |
| Shikoku | 134.27 |


International Comparison
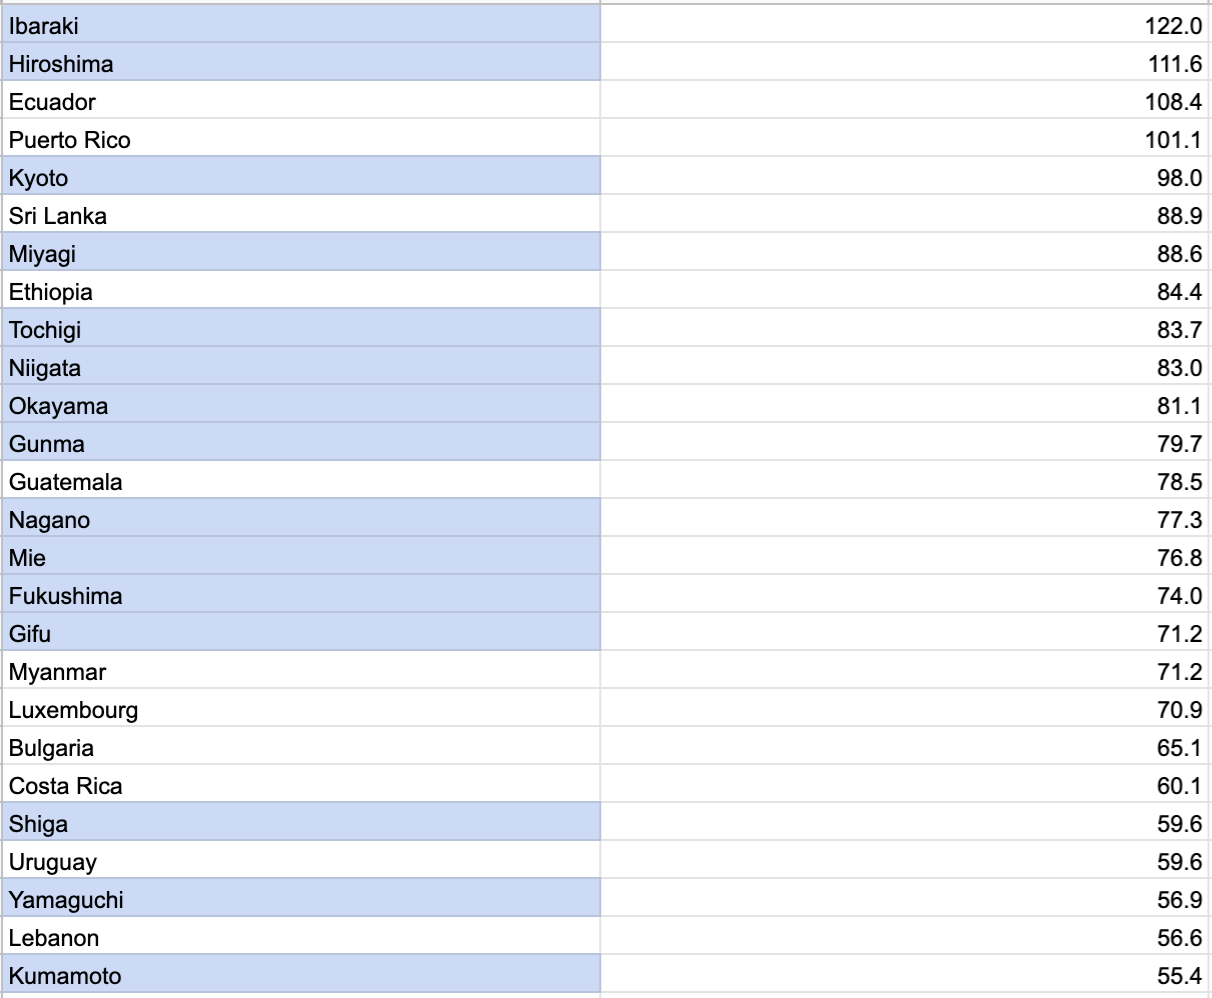
Below we compare the GDPs of Japan’47 prefectures and main economic regions to select countries. The country list comprises representative examples and is not meant to be exhaustive.


Sources: Japan Cabinet Office (in Japanese), World Bank
Lead photo: Church of La Sagrada Familia from Antoni Gaudi at golden hour. Barcelona. Spain (iStock)